Nova private beta
Join the private beta for managed Linux server monitoring.
Nova gives teams a Proxima-hosted or enterprise self-hosted control plane for Linux metrics, logs, alerts, tenant access, and Grafana SSO while V1 is shaped with early customers.
Demo video
See Nova from collector install to live dashboard.
Control plane
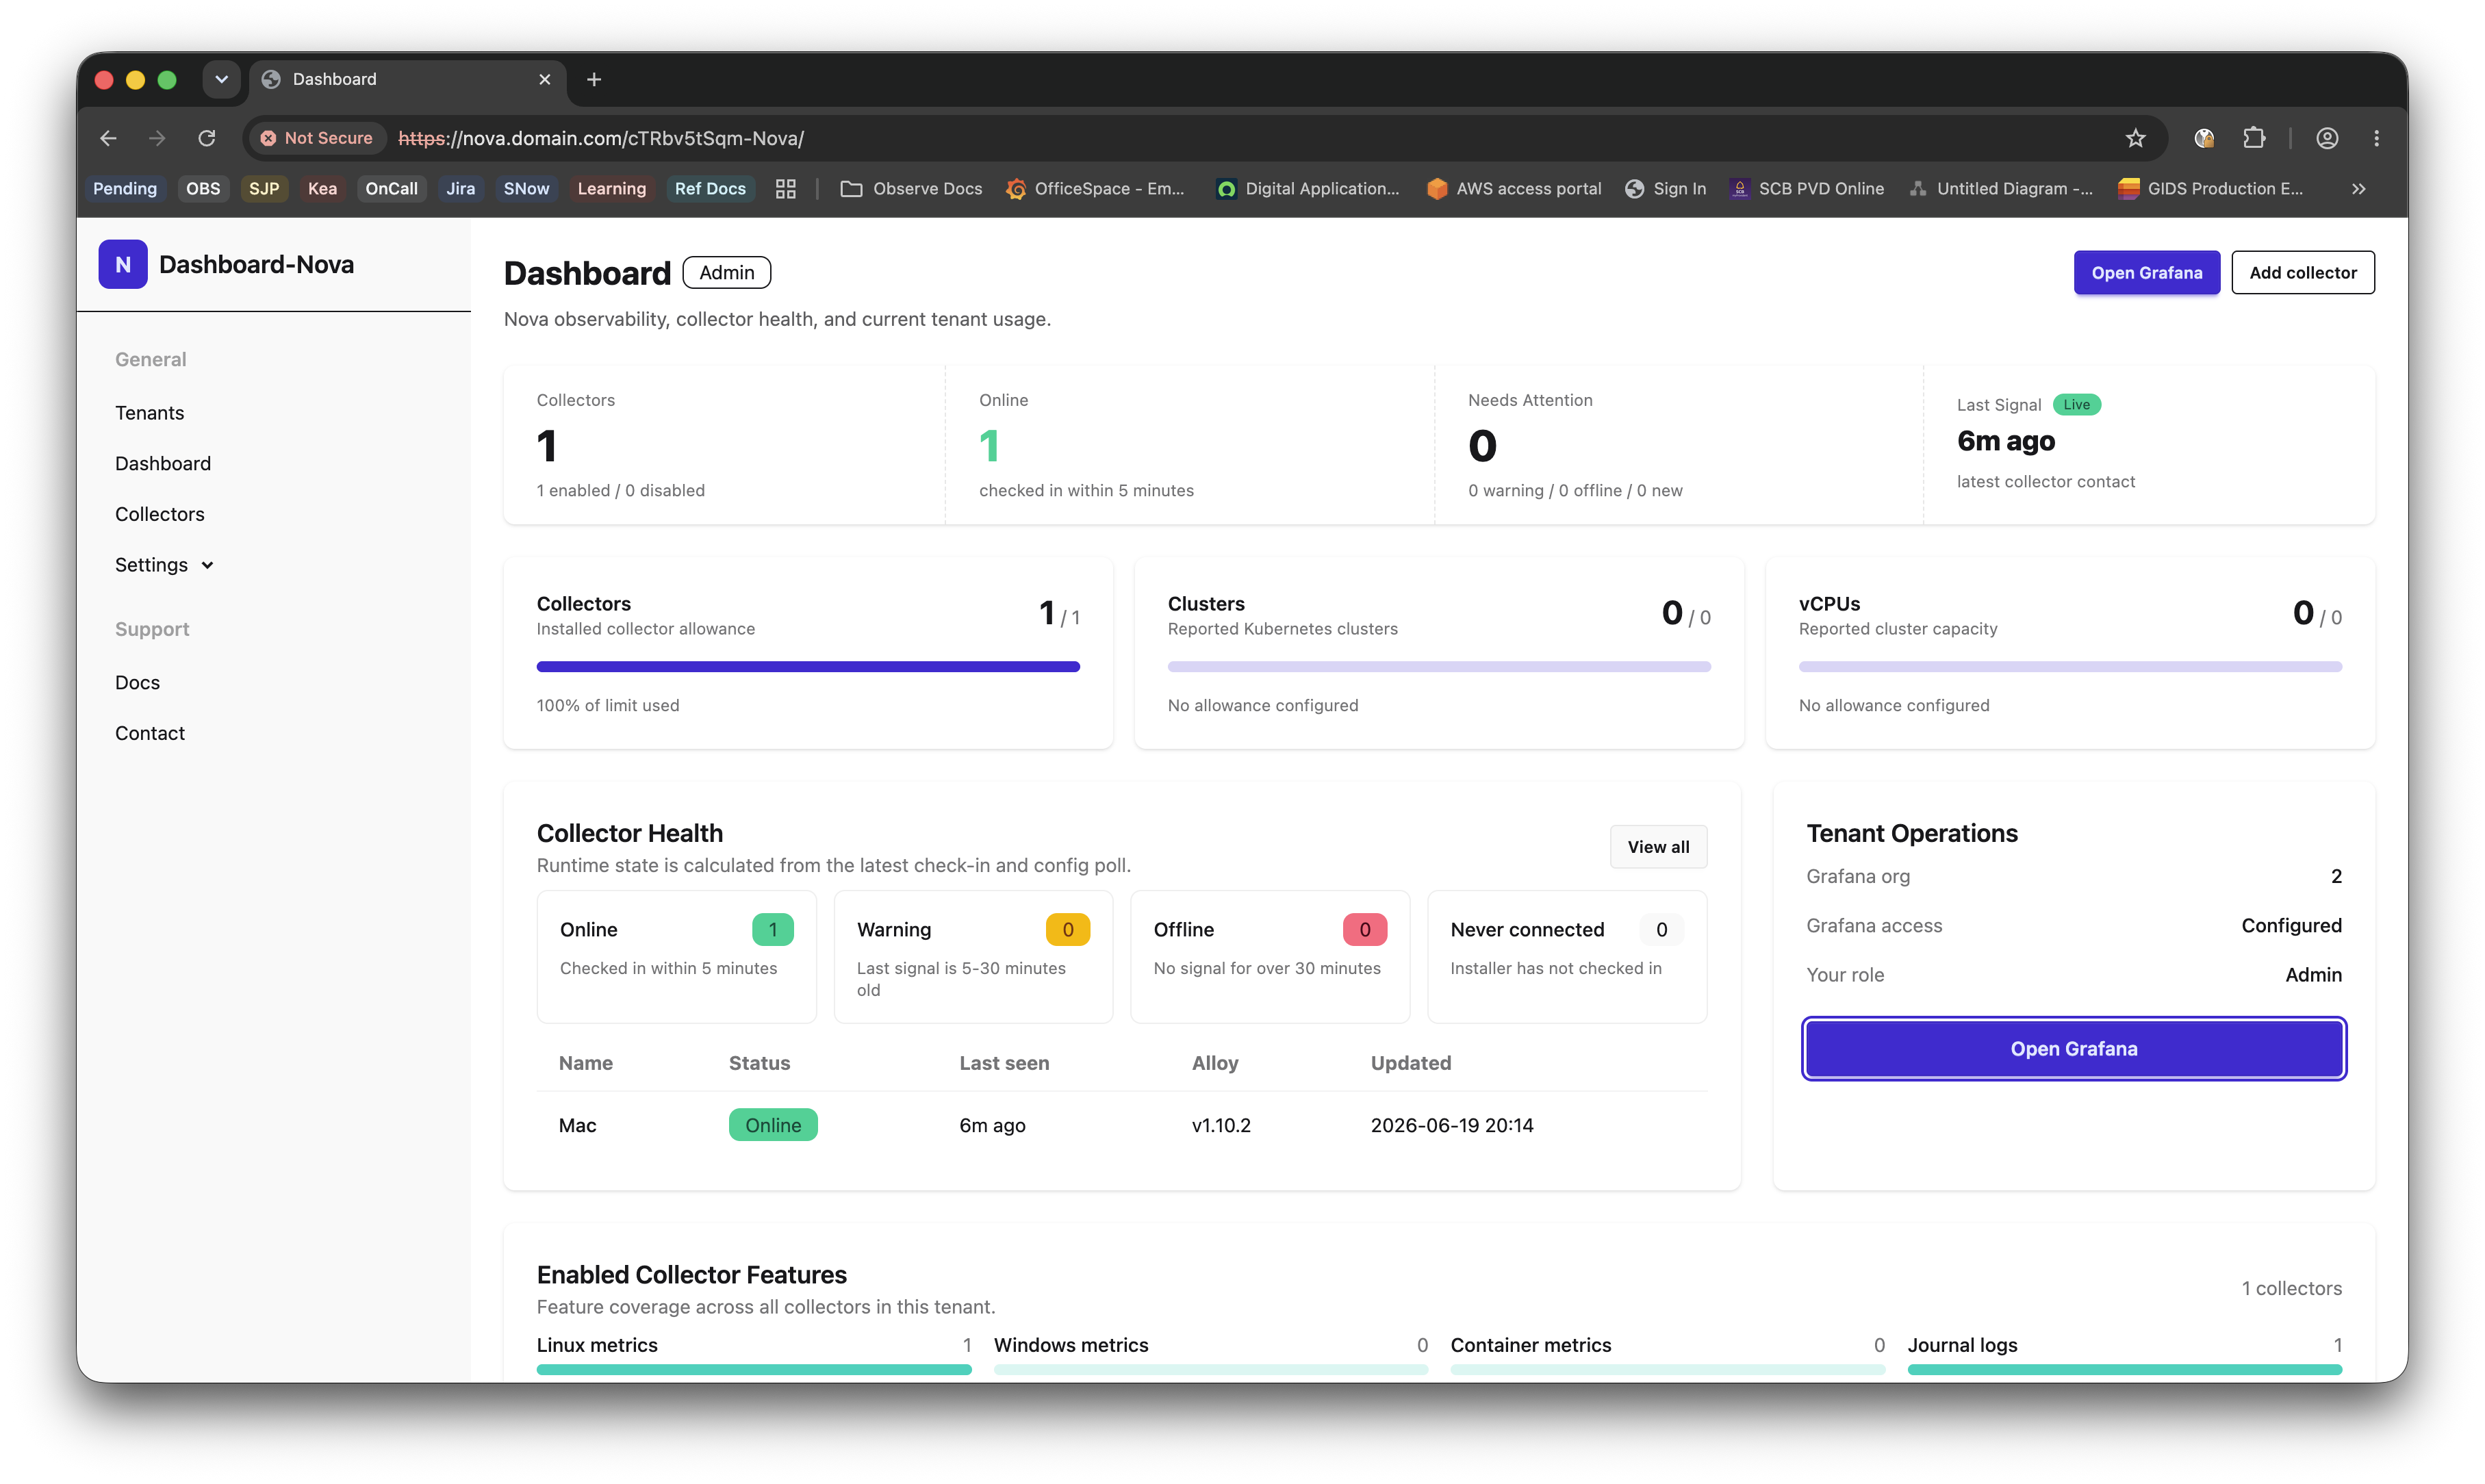
Collector status and usage overview
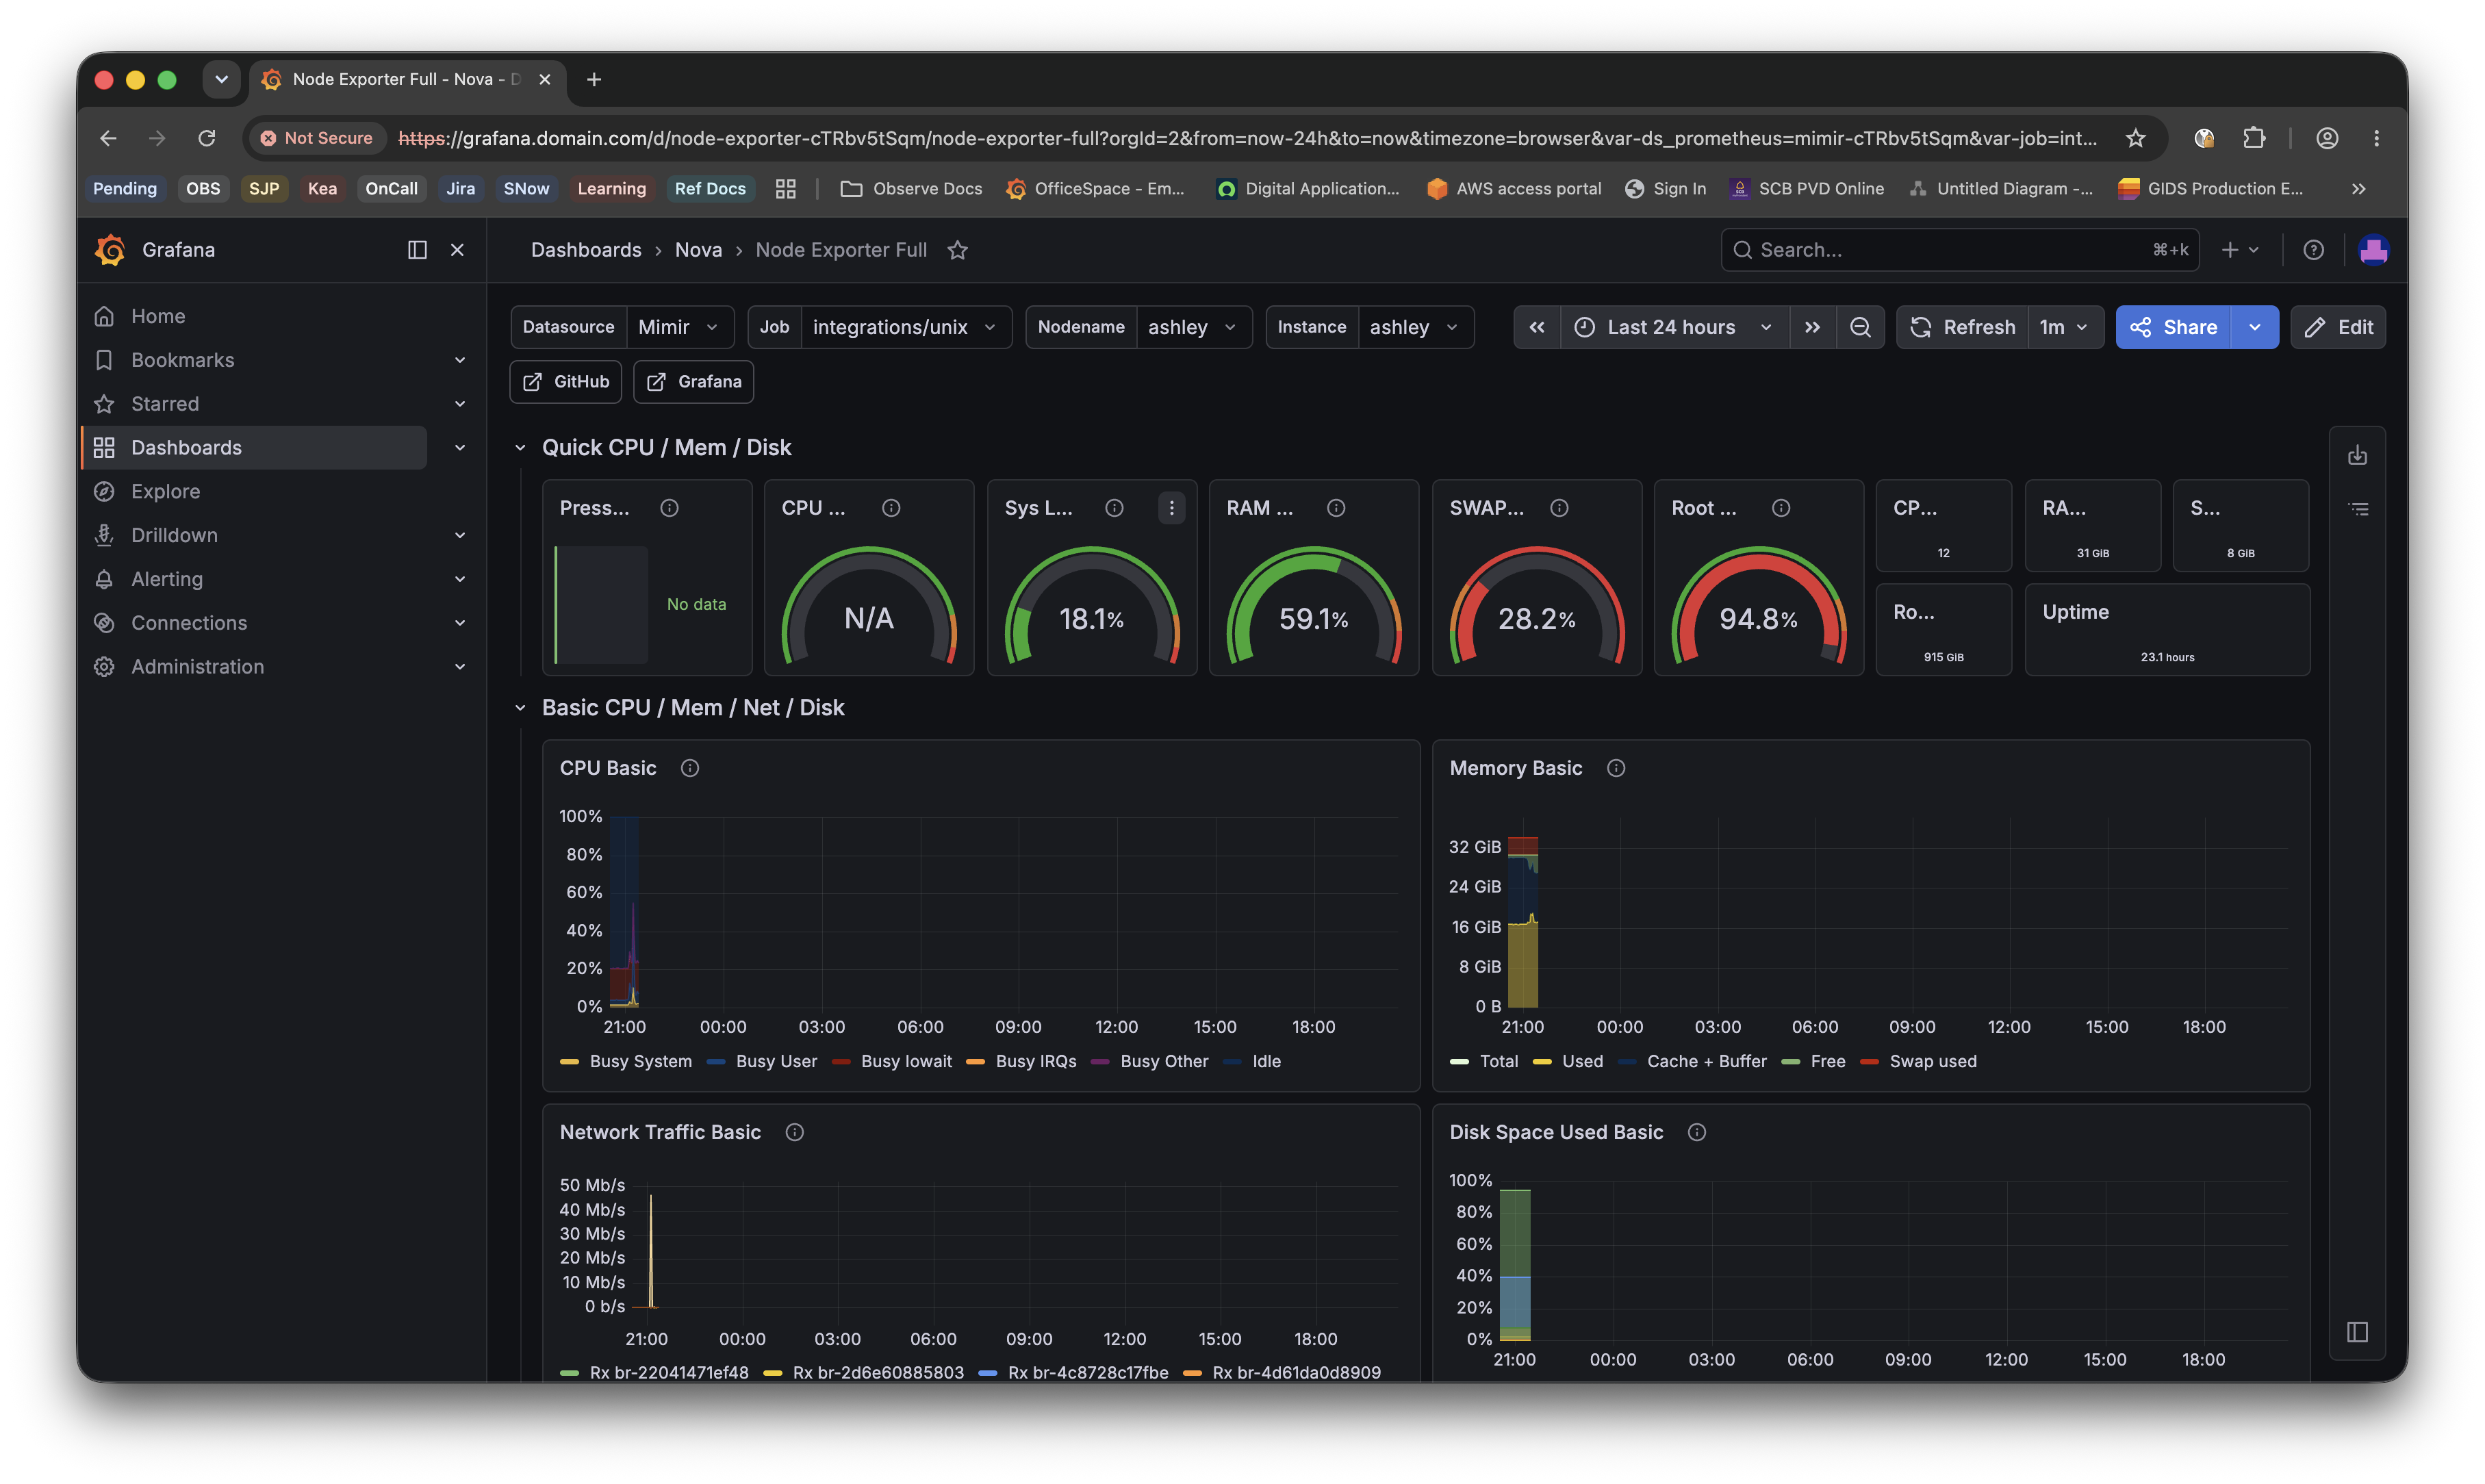
Grafana view
Linux host monitoring dashboard
Dashboard
AdminNova observability, collector health, and current tenant usage.
1 enabled / 0 disabled
checked in within 5 minutes
0 warning / 0 offline / 0 new
latest collector contact
Collectors
Installed collector allowance
100% of limit used
Clusters
Reported Kubernetes clusters
No allowance configured
vCPUs
Reported cluster capacity
No allowance configured
Collector Health
Runtime state is calculated from the latest check-in and config poll.
Checked in within 5 minutes
Last signal is 5-30 minutes old
No signal for over 30 minutes
Installer has not checked in
| Name | Status | Last seen | Alloy | Updated |
|---|---|---|---|---|
| tt | Online | 34s ago | v1.10.2 | 2026-06-13 15:04 |
Enabled Collector Features
Feature coverage across all collectors in this tenant.
V1 monitoring scope
Everything needed for managed Linux server monitoring.
Nova is intentionally focused: managed monitoring for Linux hosts, not a full Grafana Cloud replacement or Kubernetes platform.
-
Fixed Linux monitoring package
-
Nova V1 focuses on Linux hosts: CPU, memory, disks, network, uptime, Alloy health, journal logs, and fixed file paths.
-
Collector enrollment
-
Admins create a collector in Nova, receive a one-time install token, and run a generated curl/bash command on the host.
-
Tenant and role control
-
NovaUI owns tenants, team roles, limits, usage, and OIDC claims so Grafana opens in the right org with the right role.
-
Dashboards and alerts
-
V1 provisions essential Grafana dashboards and email alerts for host down, disk pressure, CPU, memory, and Alloy health.
How Nova works
From install token to Grafana dashboard.
NovaUI is the control plane. Grafana is the visualization layer. Alloy runs on each Linux host and pulls the current remote configuration from Nova.
$ curl -fsSL <generated Nova installer URL> | bash
Installing Nova Agent
Installing Grafana Alloy for linux-amd64
Writing remote config URL
Starting alloy.service
Collector online - dashboards ready
- 1 Customer account and tenant are created for private beta.
- 2 Admin adds a Linux collector and chooses optional Docker or file log features.
- 3 Nova generates a one-time install command for the host.
- 4 Alloy pulls remote config from NovaCFG and sends metrics/logs through the gateway.
- 5 Grafana shows tenant dashboards through Nova OIDC SSO.
No monitoring stack to operate
- Grafana org creation
- OIDC role mapping
- Mimir and Loki routing
Controlled host enrollment
- One-time tokens
- Tenant limits
- Usage tracking
Operational signal fast
- Linux Host Overview
- Logs Overview
- Alloy Agent Health
Nova V1 promise
"Add a server, run one install script, log into Nova, click into Grafana, and get host metrics, logs, dashboards, and alerts without running the monitoring stack."
Managed server monitoring
Hosted in Thailand or self-hosted for enterprises, powered by Grafana and Alloy
Private beta
Start with a staff-assisted Nova tenant.
Tell us how many Linux hosts you want monitored and which dashboards, logs, and alerts need to be ready first.