Nova private beta
เข้าร่วม private beta สำหรับ managed Linux server monitoring
Nova ให้ทีมของคุณมี control plane สำหรับ Linux metrics, logs, alerts, tenant access และ Grafana SSO เลือกได้ทั้งแบบ Proxima-hosted หรือ enterprise self-hosted ขณะ V1 กำลังพัฒนาร่วมกับลูกค้ากลุ่มแรก
วิดีโอสาธิต
ดู Nova ตั้งแต่ติดตั้ง collector จนถึง dashboard สด
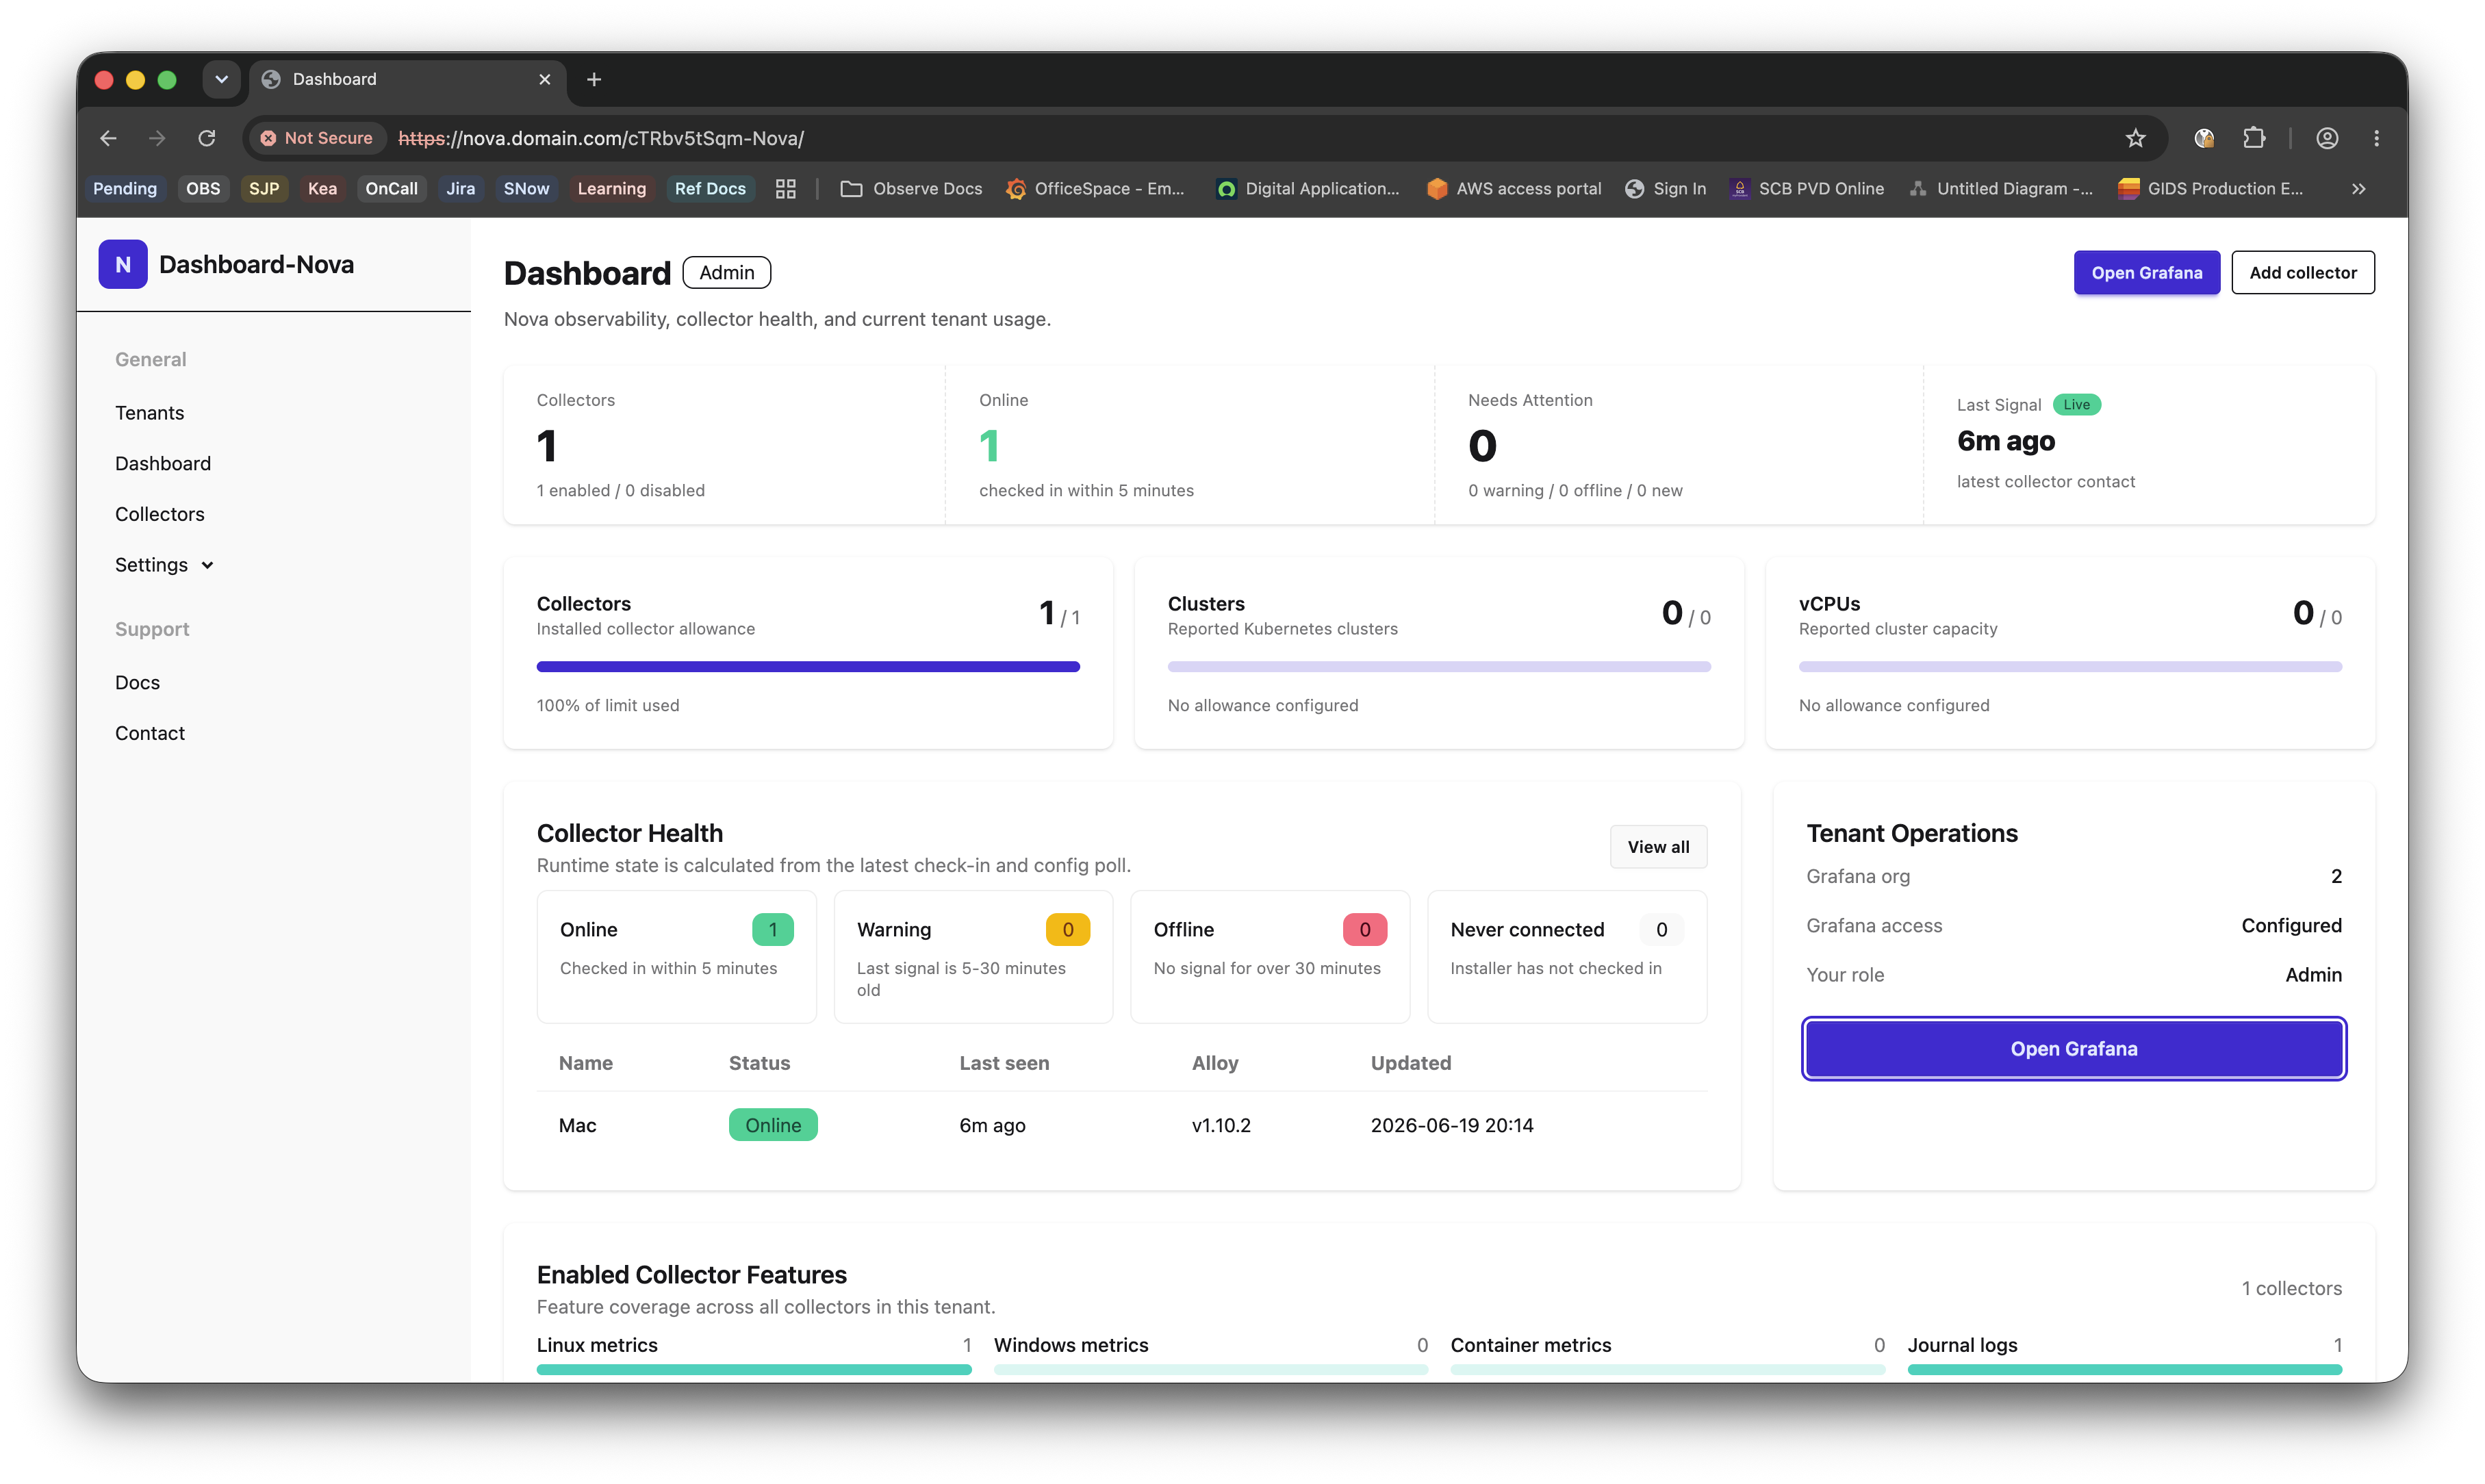
Control plane
Collector status and usage overview
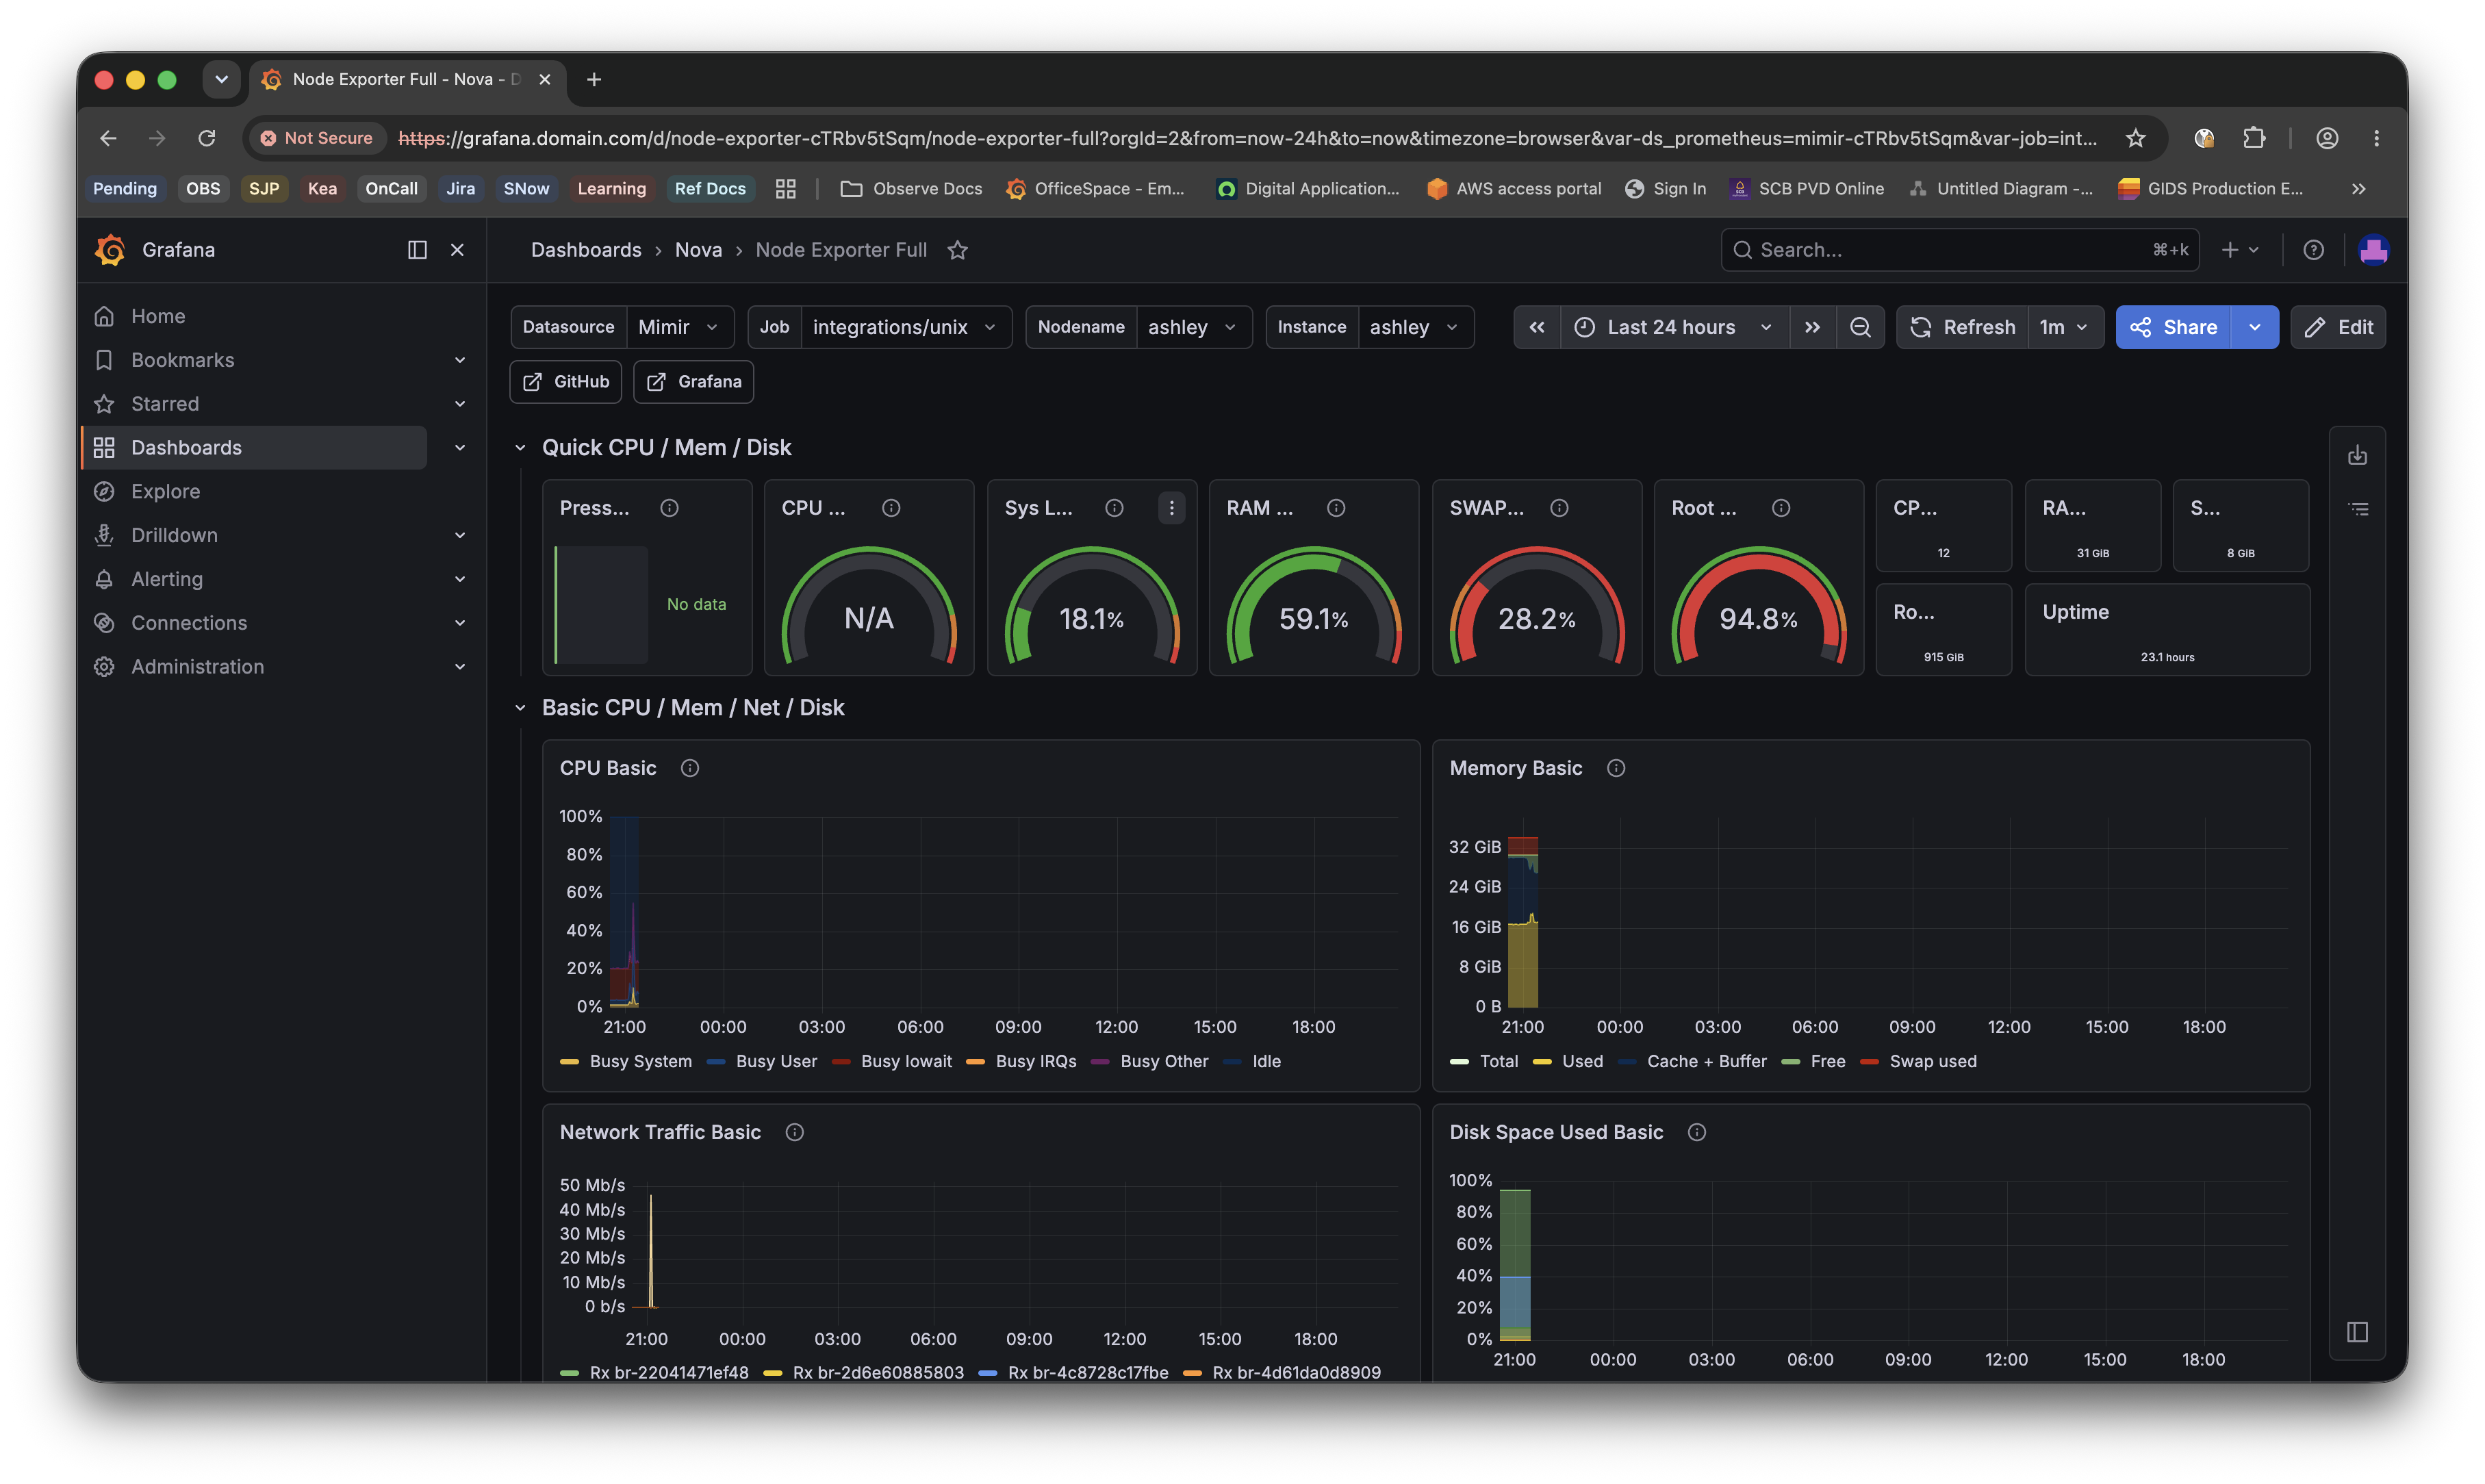
Grafana view
Linux host monitoring dashboard
Dashboard
AdminNova observability, collector health, and current tenant usage.
1 enabled / 0 disabled
checked in within 5 minutes
0 warning / 0 offline / 0 new
latest collector contact
Collectors
Installed collector allowance
100% of limit used
Clusters
Reported Kubernetes clusters
No allowance configured
vCPUs
Reported cluster capacity
No allowance configured
Collector Health
Runtime state is calculated from the latest check-in and config poll.
Checked in within 5 minutes
Last signal is 5-30 minutes old
No signal for over 30 minutes
Installer has not checked in
| Name | Status | Last seen | Alloy | Updated |
|---|---|---|---|---|
| tt | Online | 34s ago | v1.10.2 | 2026-06-13 15:04 |
Enabled Collector Features
Feature coverage across all collectors in this tenant.
ขอบเขต monitoring V1
สิ่งจำเป็นสำหรับ managed Linux server monitoring
Nova โฟกัสอย่างตั้งใจ: managed monitoring สำหรับ Linux hosts ไม่ใช่ Grafana Cloud replacement หรือ Kubernetes platform เต็มรูปแบบ
-
แพ็กเกจ Linux monitoring ที่ชัดเจน
-
Nova V1 โฟกัส Linux hosts: CPU, memory, disks, network, uptime, Alloy health, journal logs และ fixed file paths
-
Collector enrollment
-
Admin สร้าง collector ใน Nova รับ one-time install token แล้วรันคำสั่ง curl/bash ที่สร้างให้บน host
-
ควบคุม tenant และ role
-
NovaUI ดูแล tenants, team roles, limits, usage และ OIDC claims เพื่อให้ Grafana เปิดใน org และ role ที่ถูกต้อง
-
Dashboards และ alerts
-
V1 provision Grafana dashboards และ email alerts สำหรับ host down, disk pressure, CPU, memory และ Alloy health
Nova ทำงานอย่างไร
จาก install token ไปถึง Grafana dashboard
NovaUI คือ control plane ส่วน Grafana คือ visualization layer และ Alloy ทำงานบน Linux host แต่ละเครื่องพร้อมดึง remote configuration ล่าสุดจาก Nova
$ curl -fsSL <generated Nova installer URL> | bash
Installing Nova Agent
Installing Grafana Alloy for linux-amd64
Writing remote config URL
Starting alloy.service
Collector online - dashboards ready
- 1 สร้าง customer account และ tenant สำหรับ private beta
- 2 Admin เพิ่ม Linux collector และเลือก Docker หรือ file log features เพิ่มเติมได้
- 3 Nova สร้าง one-time install command สำหรับ host
- 4 Alloy ดึง remote config จาก NovaCFG และส่ง metrics/logs ผ่าน gateway
- 5 Grafana แสดง tenant dashboards ผ่าน Nova OIDC SSO
ไม่ต้องดูแล monitoring stack
- Grafana org creation
- OIDC role mapping
- Mimir และ Loki routing
ควบคุม host enrollment
- One-time tokens
- Tenant limits
- Usage tracking
เห็นสัญญาณระบบได้เร็ว
- Linux Host Overview
- Logs Overview
- Alloy Agent Health
คำมั่นของ Nova V1
"เพิ่ม server, รัน install script เดียว, login เข้า Nova, เปิด Grafana แล้วได้ host metrics, logs, dashboards และ alerts โดยไม่ต้องดูแล monitoring stack เอง"
Managed server monitoring
โฮสต์ในประเทศไทยหรือ self-hosted สำหรับองค์กร ขับเคลื่อนด้วย Grafana และ Alloy
Private beta
เริ่มต้นด้วย Nova tenant ที่มีทีมงานช่วย onboarding
บอกเราว่าต้องการ monitor Linux hosts กี่เครื่อง และ dashboards, logs, alerts ใดควรพร้อมใช้งานก่อน